 If you took out $20,000 in student loans, and if you were able to pay about $125.99 a month, you could pay everything off in 20 years, as long as the loans were either direct subsidized or direct unsubsidized. In total, you would end up paying $30,237.60. The interest rate I used for this post was 4.45%, but if I had used another interest rate, the total amount of money you'd pay would either increase or decrease, depending on the rate and if it was higher or lower than the one used.
It was surprising to me that it can take 20 years to pay off $20,000, even if you're paying $126 a month. I did not imagine that it would take so long and be so costly to pay off loans, even if it was only $20,000 and you paid over a hundred of that each month. This activity definitely put a lot into perspective for me.
0 Comments
 The connection between factors and zeros is that factors are basically zeros! What I mean by this is, if a problem's factored form is (x-3)(x+5)(x+8) the zeros would be 3, -5, and -8. By using division to help us find factors, we can break easily see what a factor is without having to guess and check multiple things. Division also makes it easy to find zeros, which, as I said, will lead you directly to the zeros.
The degree of a polynomial tells how many zeros we should initially look for, but it doesn't necessarily tell us the exact amount that we will have. A problem can have repeating zeros that may or may not be accounted for in the equation. Therefore, it won't always tell us how many factors the problem has. Polynomials are a great way to know where to start, but they are not everything. You must always be careful and check your work to know for sure when you have finished with a problem and have arrived at the correct solution. 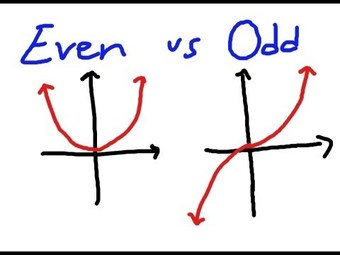 I learned a lot from this activity. First and foremost, I learned that there are even such things as "even and odd" functions. I also learned how to tell which is which and the best ways to check my graphs. Even and odd functions are similar in the sense that they both must have two components that equal an identical amount. Some differences however are that to be even a function's f(x) must be equal to f(-x) and to be odd a function's f(-x) must be equal to -f(x). While an even function's graph looks like a mirror image across the y-axis, an odd one will look like a reflection; it will be the same but exactly opposite across the y-axis.
To check whether a function is even or odd, simply do the operations that I have listed off above. Some function families that are even are parabolas and lines, and one that is odd is the cubed root function family. My biggest question for this section is if there is any easier way to remember that to find if a function is odd you DON'T use the standard f(x) when comparing variations of the function. Today we looked at a video about skateboards and the effect of different ramps on distance traveled. This activity was used to make predictions about graphs and compare them to the actual line. There were three different ramps used, the first distance a 21 inch drop, the second a 14 inch drop, and the final one a 7 inch drop.
My predictions were that the slope for the 21 inch trial would be the most steep. I figured this because the was the most extreme of the three ramps. Things tend to go faster the more they are angled. I didn't expect the graphs to be U-shaped, but my overall predictions were fairly close to realty. I also did not account for the graphs having a roll-back period. Each graph had maximums as well, which I also predicted. Not only did they all hit a maximum, but their maximums were rather close, only differing by a few feet. Both the real and predicted graphs rose and fell at mostly the same rate and place on the coordinate plane too. Overall, my guesses were quite correct. All I really had to do to get accurate readings was watch the video and have a basic understanding of how things like physics work. Sure, my predictions were not perfect but I am pleased with how they turned out. 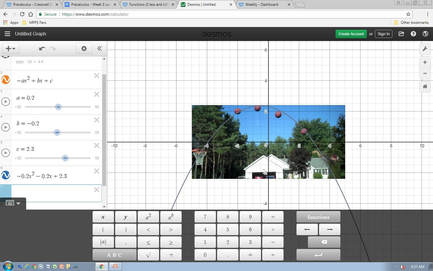 From the graph shown here, my hypothesis is that the ball will go into the hoop. The graph is -0.2x^2-0.2x+2.3
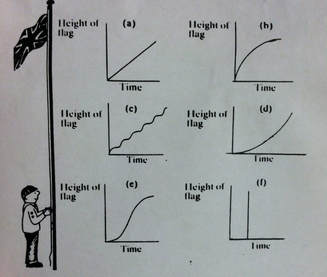 Each morning, a young boy raises a flag at his summer camp. The graphs below show different ways in which the boy could have raised the flag. Graph A shows the boy raising the flag at a steady, constant rate. Graph B shows the boy raising the flag quickly at the start but then slowing and gradually stopping. Graph C shows the boy raising the flag a bit, taking a short break, and then continuing to raise the flag in short bursts with small brakes in between. Graph D shows the boy starting to raise the flag slowly and getting exponentially faster the higher the flag is raised. Graph E shows the boy starting slowly, and then having a sudden burst of movement which begins to plateau as he reaches the top of the pole. Graph F seems to show the boy suddenly teleporting the flag to the top of the flag pole suddenly after a bit of time has past.
I believe that graph A is the most realistic of the six. This graph shows steady, consistent action. Because raising a flag is not very taxing, the boy would have no need to take breaks, such as graph C suggests. It is the most realistic to expect that he had a consistent pace when raising the flag because, while possible to raise the flag in the ways shown in graphs B, D, or E, there is no real need for such a dramatic change in pace. Graph F is obviously the most incorrect. No one could raise a flag all at once like it suggests. The boy may be able to raise a flag quickly, but the line would have more variation in it than just going straight upwards. In fact, graph F is the only graph shown that is totally impossible. |
AuthorPeri Sanderson is a Pre Calc student at MPHS Archives
November 2017
Categories |
 RSS Feed
