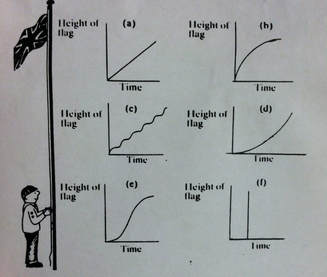
 Each morning, a young boy raises a flag at his summer camp. The graphs below show different ways in which the boy could have raised the flag. Graph A shows the boy raising the flag at a steady, constant rate. Graph B shows the boy raising the flag quickly at the start but then slowing and gradually stopping. Graph C shows the boy raising the flag a bit, taking a short break, and then continuing to raise the flag in short bursts with small brakes in between. Graph D shows the boy starting to raise the flag slowly and getting exponentially faster the higher the flag is raised. Graph E shows the boy starting slowly, and then having a sudden burst of movement which begins to plateau as he reaches the top of the pole. Graph F seems to show the boy suddenly teleporting the flag to the top of the flag pole suddenly after a bit of time has past.
I believe that graph A is the most realistic of the six. This graph shows steady, consistent action. Because raising a flag is not very taxing, the boy would have no need to take breaks, such as graph C suggests. It is the most realistic to expect that he had a consistent pace when raising the flag because, while possible to raise the flag in the ways shown in graphs B, D, or E, there is no real need for such a dramatic change in pace. Graph F is obviously the most incorrect. No one could raise a flag all at once like it suggests. The boy may be able to raise a flag quickly, but the line would have more variation in it than just going straight upwards. In fact, graph F is the only graph shown that is totally impossible.
0 Comments
Leave a Reply. |
AuthorPeri Sanderson is a Pre Calc student at MPHS Archives
November 2017
Categories |
 RSS Feed
